
 How should I set and manage the "thresholds" that notify me of anomalies in Excel?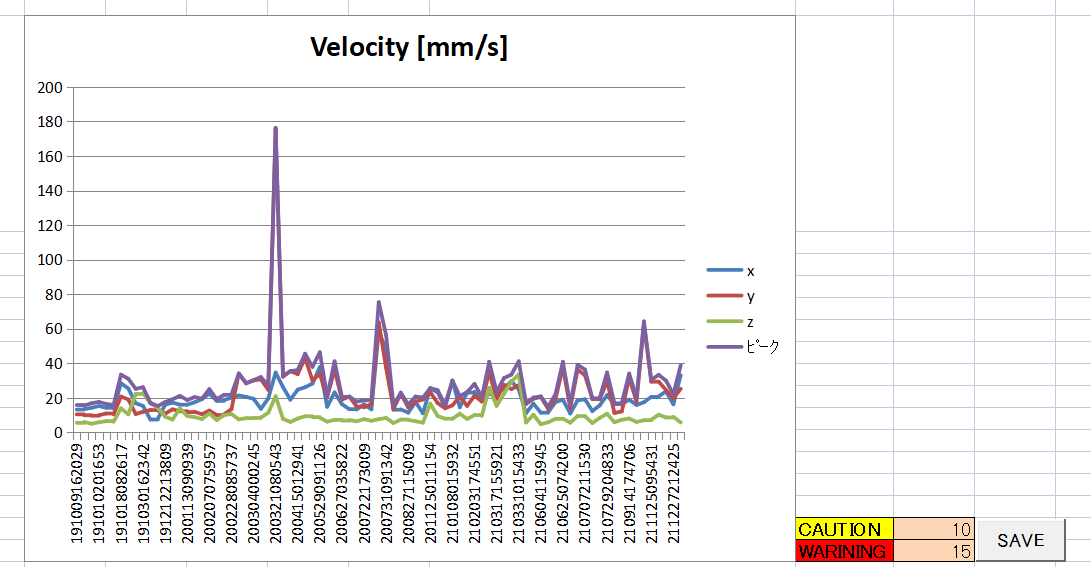



[Conclusion] Since you won't know the indicators at first, the most practical approach is to set the baseline based on your equipment's normal operation to 200% for Caution (Yellow) and 400% to 500% for Warning (Red), and manage them in a list using Excel. After that, revising the thresholds based on continuous vibration measurement will become a crucial piece of know-how for equipment management. By using the free "Simple Diagnosis Macro" provided by conanair, the latest velocity RMS (vibration energy) at each measurement point is automatically compared with your set thresholds and color-coded as Normal, Caution, or Warning. This ensures early detection of anomalies and proactive awareness of danger.
"I don't know how to utilize the collected CSV data." "I'm unsure how to determine the criteria (thresholds) for judging anomalies."
To solve such on-site issues, conanair provides free tools that can handle everything from daily trend management to precise frequency analysis. We will explain how to interpret specific data and how to utilize the Excel worksheets.
This is an Excel macro that displays a list of the latest vibration data collected from multiple measurement points, allowing you to grasp the health status of your equipment at a glance.
Targeting the latest data from each measurement point, it automatically color-codes the display on the screen into Blue (Normal), Yellow (Caution), and Red (Warning) based on the "thresholds" set by the user.

With the latest version update, you can now directly load not only the automatically generated "CSV files" but also conanair's specific ".cna files".
As a result, even when targeting data files (.cna) measured and downloaded in manual mode, you no longer need to go through the trouble of converting them to CSV using the included app, allowing for immediate list display and judgment (In automatic mode, it loads the automatically generated CSV data as before).
While there are absolute value indicators defined by ISO for determining anomalies, they often cannot be smoothly applied to on-site equipment. Therefore, the basic rule is to set the "trend data of your own equipment during normal operation" as the baseline.
To simplify management, basically use "Velocity RMS (3D composite value)" as the indicator and calculate using the following formulas:
Since the difference in quality may appear significantly in specific measurement directions, caution is necessary depending on the characteristics of your equipment.
Open the downloaded Excel file with macros, and enter the measurement points and the calculated thresholds. After that, automatic judgment is performed simply by importing the latest data (measurement points without set thresholds will remain clear).
Since numerous measurement points are managed collectively on the Excel file and the status of each machine is visually color-coded, it becomes easy to implement an operation that detects on-site "danger" in advance, such as checking only the red or yellow spots first thing in the morning, even without specialized knowledge.
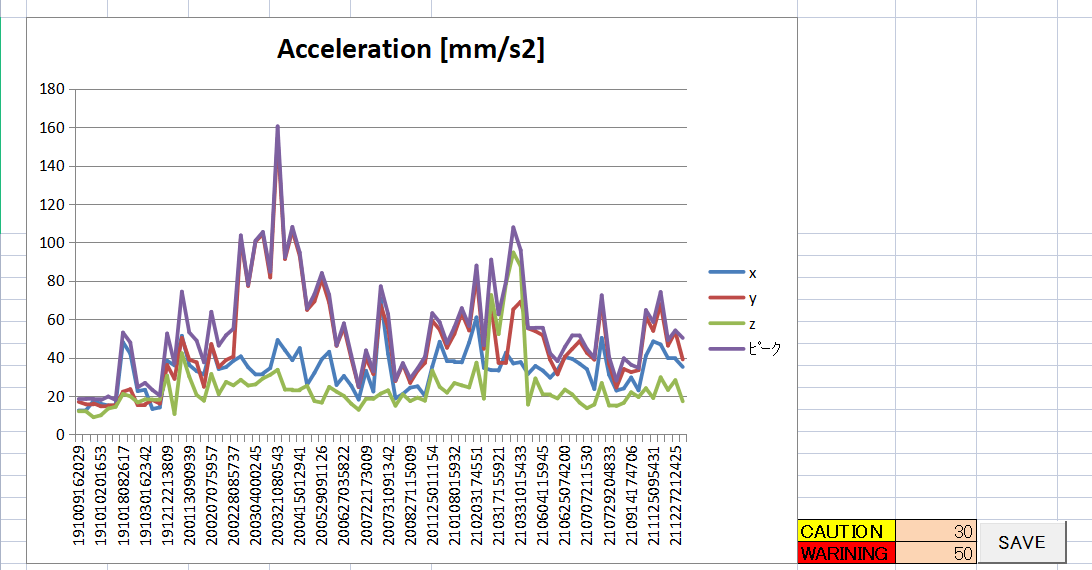
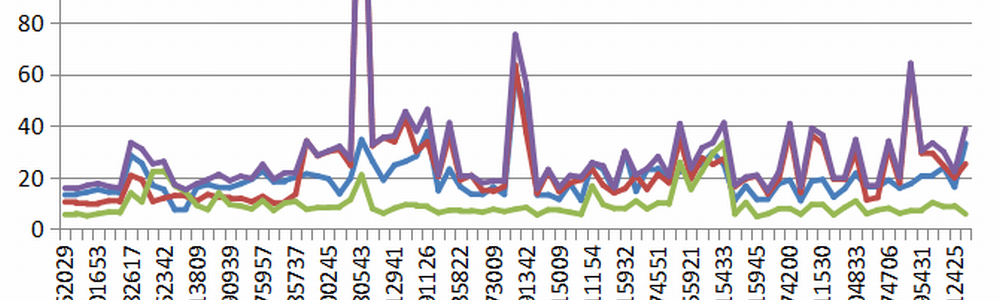
This is an Excel macro that loads multiple past data entries (CSV) from a specific measurement point and automatically creates a trend graph.
Its main purpose is report creation, and it is highly convenient when you want to observe differences in each measurement direction (X, Y, Z), RMS, or peak values.
The visual information of a line graph trending up or down, rather than just single numerical values, is extremely effective in catching signs of failure. You can also enter and save thresholds for "CAUTION" and "WARNING" from the settings field on the bottom right.
* We are currently transitioning this feature to a dedicated web browser application.
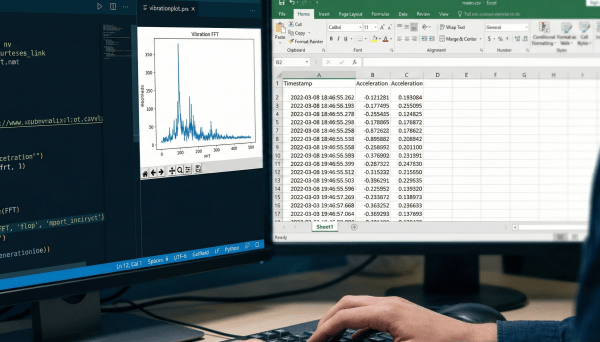
This is a browser-exclusive application that performs frequency analysis via FFT (Fast Fourier Transform) and raw waveform graph display for a specific piece of measurement data. No software installation is required; you can use it simply by opening the extracted HTML file.
Sample data for verification is included with the app. Please load the "Normal (NORM)" and "Anomaly (oNG)" waveform data to actually experience how frequency peaks appear when an anomaly occurs.
You can download the various tools in ZIP format from the links below.
Disclaimer and Support
The Excel macros and tools provided are offered as samples. Depending on your PC environment, Windows, or Excel versions, they may not operate correctly. Please utilize them with the understanding that we do not provide technical support for Excel tailored to individual user environments. However, if you have any questions regarding how to interpret data using these tools, setting "thresholds," or operational methods, we will provide advice as much as possible, so please feel free to contact us.
| Company Name | NSXe Co.Ltd - Nakayama Hydrothermal Industry Co., Ltd. |
|---|---|
| Head Office | 7686-10 Hirano-cho, Suzuka, Mie513-0835, Japan zip code 513-0835 |
| Phone | +81-90-2189-1398 |
| FAX | +81-59-379-4704 |
| Business Hours | 8:00~17:00 |
| Office Regular Holiday |
Saturday afternoons, Sundays and public holidays |
| URL | https://conanair.com/ |
| Company Name | NSXe Co.Ltd - Nakayama Hydrothermal Industry Co., Ltd. |
|---|---|
| Head Office | 7686-10 Hirano-cho, Suzuka, Mie513-0835, Japan zip code 513-0835 |
| TEL | +81-90-2189-1398 |
| FAX | +81-59-379-4704 |
| Business Hours | 8:00~17:00 |
| Office Regular Holiday |
Saturday afternoons, Sundays and public holidays |
| URL | https://conanair.com/ |