

[Conclusion] Yes, it is completely possible. conanair is designed with an open-data philosophy, ensuring vibration data is never black-boxed. Raw acceleration data (96,000 points per measurement) can be exported as CSV, and trend CSV files for long-term monitoring are automatically generated. This allows engineers to easily perform custom FFT analysis with Python or integrate the data into existing in-house maintenance systems and AI training models.
conanair insists on an open specification that allows engineers to freely utilize acquired vibration data, without black-boxing it.
Here, we introduce the conanair data flow and analysis examples using the included trend data (CSV).
conanair acquires 10 seconds of vibration data per measurement and saves it as a proprietary compressed file (.cna).
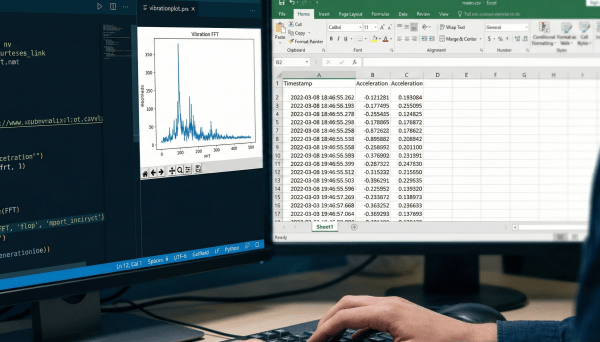
This .cna file contains 96,000 points of raw acceleration data, which can be converted to "waveform data" in CSV format using the included app.
This means engineers can visualize "equipment health" in Excel or Python immediately without tedious data organization.
The automatically generated trend CSV (e.g., conanair-1.csv) records key parameters in time series as follows:
Tag, MeasureTime, VelRms3D, HAccPk3D, Dev_Tmp ...
conanair-1, 2022/06/09 10:38:59, 0.243, 1.680, 25.5
conanair-1, 2022/06/09 10:40:00, 0.247, 1.039, 25.7
conanair-1, 2022/06/09 10:40:59, 0.246, 0.892, 25.8
...
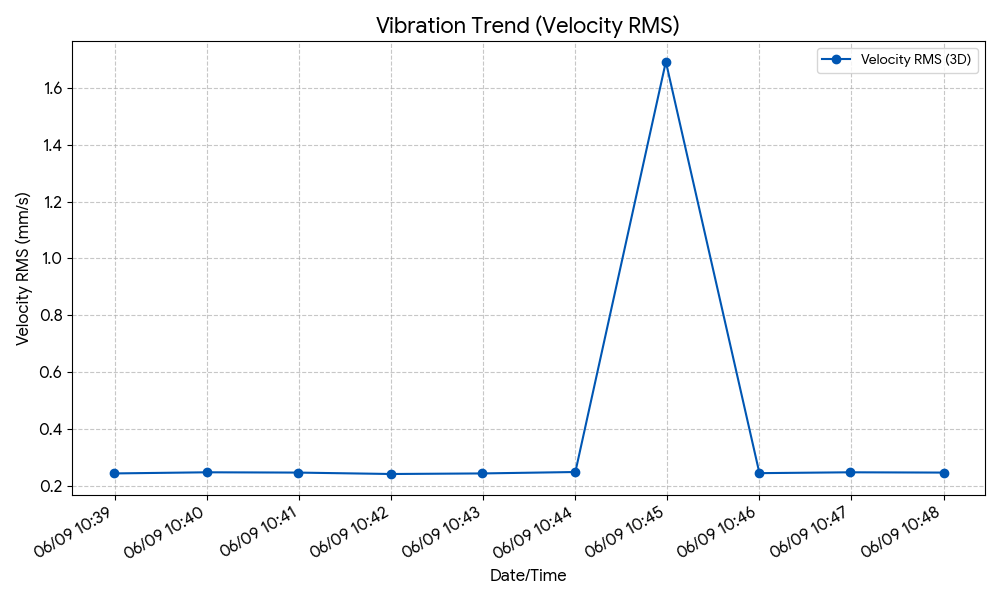
By reading the accumulated CSV data with Python, you can instantly create "Vibration Trend Graphs" like the one below.
Below is the sample Python code to plot this graph.
import pandas as pd
import matplotlib.pyplot as plt
# 1. Load Trend CSVdf = pd.read_csv('conanair-1.csv')
df['MeasureTime'] = pd.to_datetime(df['MeasureTime'])
# 2. Plot Graph (Velocity RMS Trend)plt.figure(figsize=(10, 6))
plt.plot(df['MeasureTime'], df['VelRms3D'], marker='o', label='Velocity RMS (3D)')
plt.title('Vibration Trend')
plt.xlabel('Date/Time')
plt.ylabel('Velocity RMS (mm/s)')
plt.grid(True)
plt.legend()
plt.show()
With closed, proprietary systems where the analysis process is black-boxed, you cannot fine-tune the algorithm even if false alarms occur. However, in an environment like conanair where you can retain the raw waveform data (CSV), you can use Python to freely implement custom processes as your own code—such as "filtering only specific noise frequency bands (e.g., band-pass filters)" or "setting unique thresholds based on field rules of thumb."
This means that instead of relying on a generalized AI provided by another company, you can directly codify the deep knowledge of your maintenance engineers, who understand your equipment's unique characteristics best, and grow a highly accurate predictive maintenance system that truly works in your facility.
As shown, conanair prioritizes "returning data to the hands of engineers." It is ideal for integration into in-house maintenance systems or as training data for AI predictive maintenance.
| Company Name | NSXe Co.Ltd - Nakayama Hydrothermal Industry Co., Ltd. |
|---|---|
| Head Office | 7686-10 Hirano-cho, Suzuka, Mie513-0835, Japan zip code 513-0835 |
| Phone | +81-90-2189-1398 |
| FAX | +81-59-379-4704 |
| Business Hours | 8:00~17:00 |
| Office Regular Holiday |
Saturday afternoons, Sundays and public holidays |
| URL | https://conanair.com/ |
| Company Name | NSXe Co.Ltd - Nakayama Hydrothermal Industry Co., Ltd. |
|---|---|
| Head Office | 7686-10 Hirano-cho, Suzuka, Mie513-0835, Japan zip code 513-0835 |
| TEL | +81-90-2189-1398 |
| FAX | +81-59-379-4704 |
| Business Hours | 8:00~17:00 |
| Office Regular Holiday |
Saturday afternoons, Sundays and public holidays |
| URL | https://conanair.com/ |