


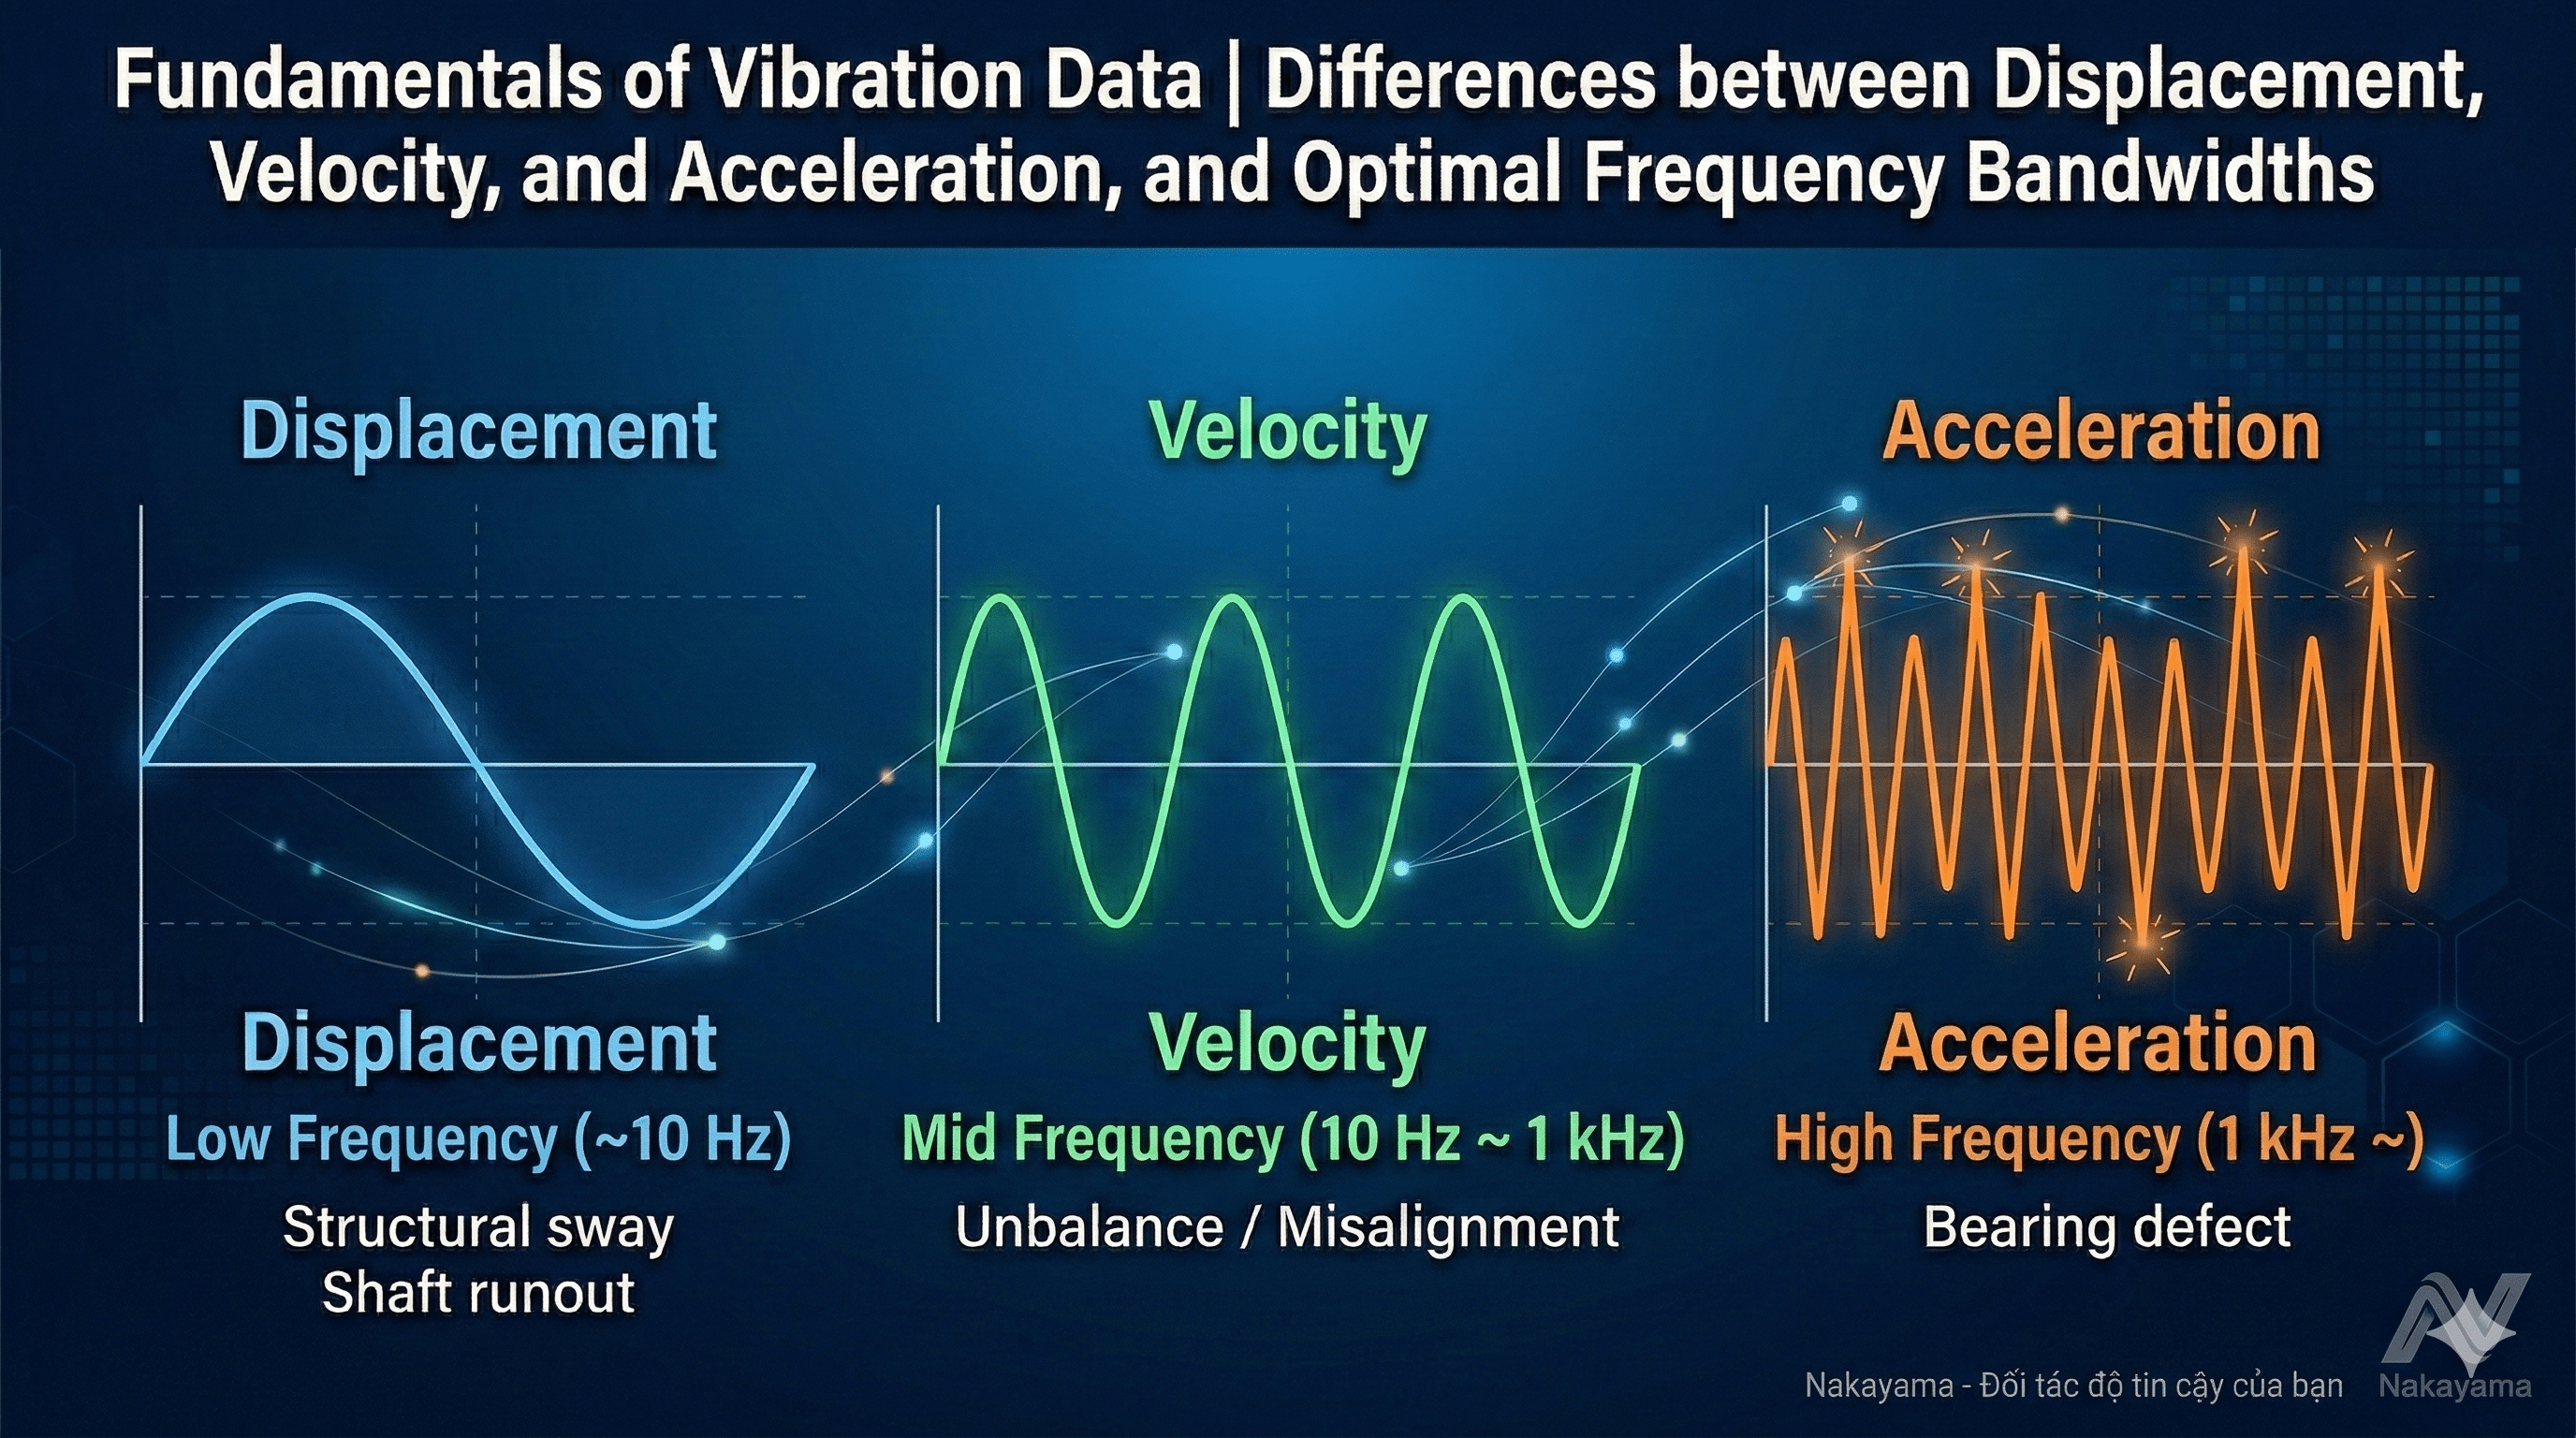
In equipment diagnosis, correctly evaluating vibration strictly requires understanding three metrics: "Displacement," "Velocity," and "Acceleration," and using them appropriately according to the target anomaly (frequency band).
The "sensitivity" of these metrics varies greatly depending on the frequency of the target vibration. To get straight to the point, as the frequency increases, the "change per unit of time" becomes much steeper, causing the values (sensitivity) for velocity and acceleration to jump significantly.
| Metric | Optimal Frequency Band | Primary Diagnostic Targets (Types of Anomalies) | Sensitivity Characteristics |
|---|---|---|---|
| Displacement | Low Frequency (~10Hz) | Building sway, shaft runout of large rotating machinery, piping vibration, etc. | Constant regardless of frequency |
| Velocity | Mid Frequency (10Hz~1kHz) | Unbalance, misalignment (shaft deviation), looseness, etc. | Proportional to frequency |
| Acceleration | High Frequency (1kHz~) | Bearing flaws, gear chipping, metal-to-metal impacts | Proportional to the square of the frequency |
Why does the sensitivity of velocity and acceleration increase as the frequency rises? Imagine shaking an object with the "same amplitude (displacement)."
The relationship between vibration metrics can be clearly explained mathematically using "differentiation." If we consider vibration as a simple sine wave, the relationships are as follows.
* Let $t$ be time, $f$ be frequency, and $A$ be amplitude (displacement).
■ Displacement ($x$)
This is the baseline amplitude.
$$x=A\sin(2\pi ft)$$
■ Velocity ($v$)
Differentiate displacement once with respect to time $t$.
$$v=\frac{dx}{dt}=A(2\pi f)\cos(2\pi ft)$$
→ Since one $f$ appears at the beginning of the equation, velocity is proportional to frequency.
■ Acceleration ($a$)
Differentiate velocity once more (differentiate displacement twice).
$$a=\frac{dv}{dt}=-A(2\pi f)^2\sin(2\pi ft)$$
→ Since $f^2$ appears at the beginning of the equation, acceleration is proportional to the square of the frequency.
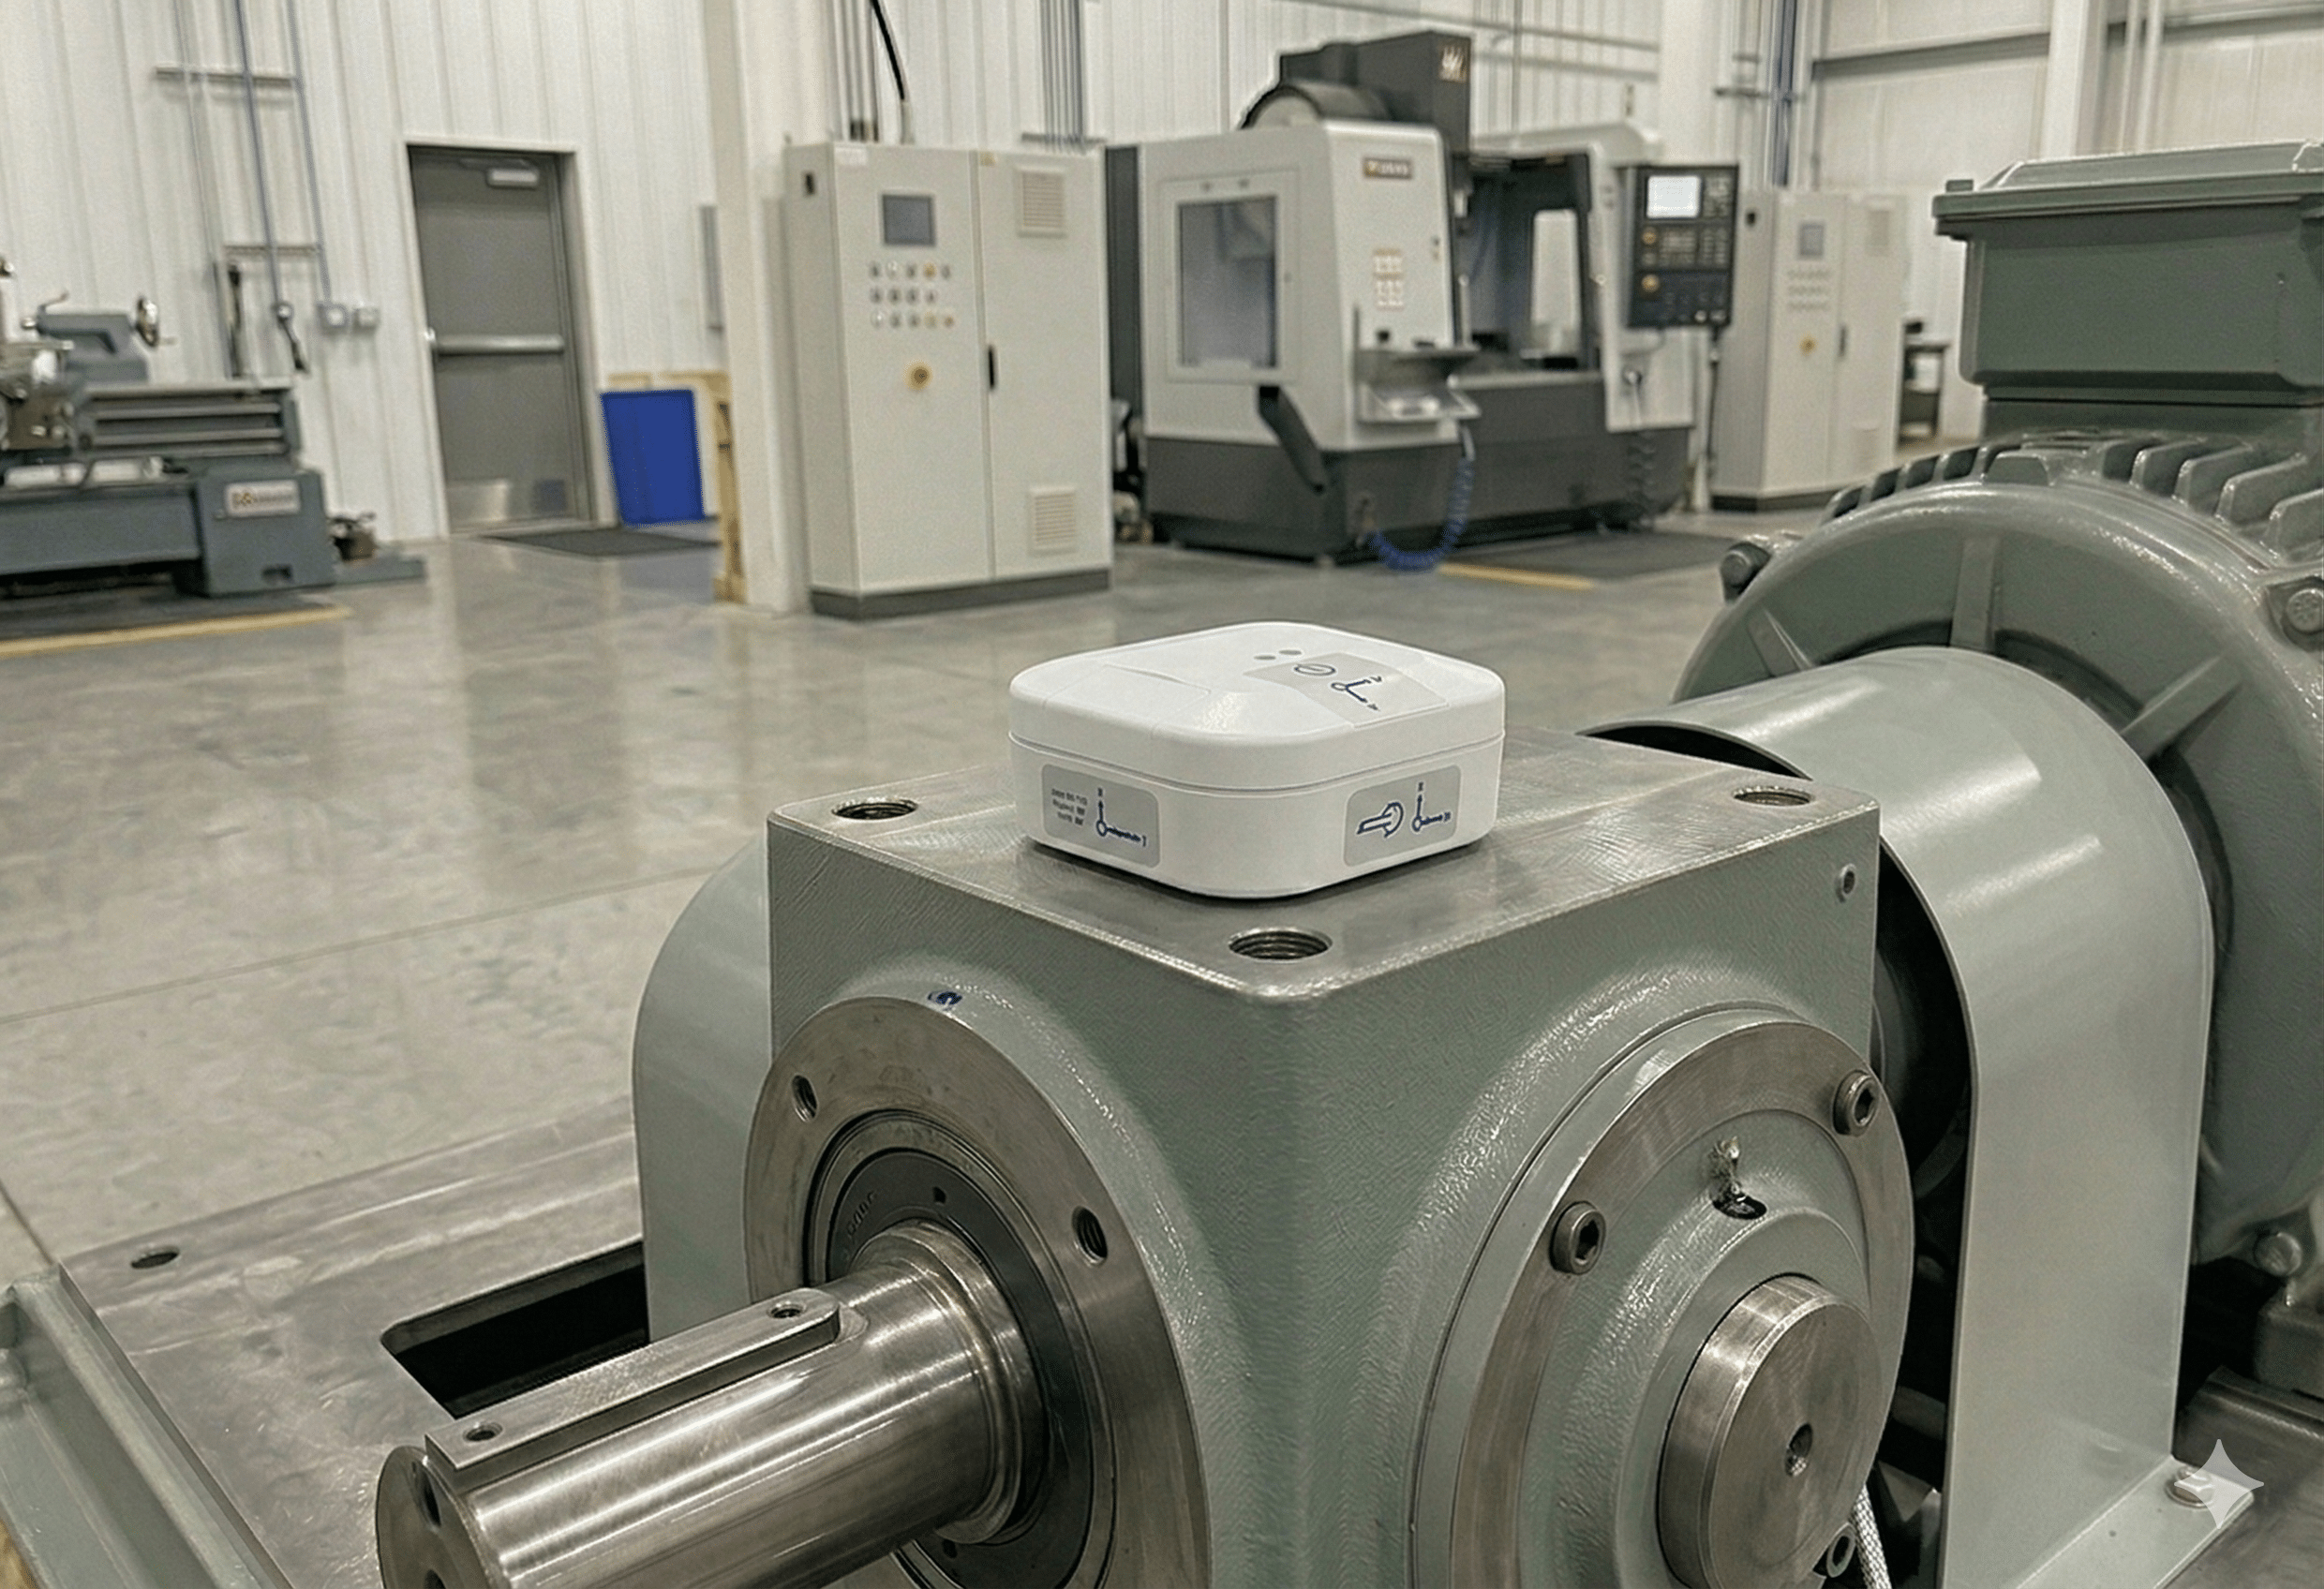
In actual field diagnostics, it is necessary to select sensors while understanding the relationship between frequency and sensitivity. The wireless vibration sensor "conanair" adopts a unique design that covers both the "mid" and "high" frequency ranges, which are practically the most important.
Here, we honestly share the facts with our field users. Because under-sampling technology reflects high frequencies into lower frequency bands, there is a clear limitation (disadvantage): "precise absolute value measurement of high-frequency vibration is impossible."
However, when focusing strictly on the bearings of general-purpose rotating machinery, high-frequency vibrations do not occur during normal operation. In other words, rather than knowing "exactly what the absolute value is," reliably capturing the fact that "a high frequency that shouldn't normally occur has appeared" is the most critical factor in trend management (relative comparison) when an anomaly occurs.
The biggest reason we accept the disadvantage of not measuring absolute values—in exchange for drastically reducing data size—is to prevent the "black-boxing of edge processing" that has become mainstream recently.
Most edge processing transmits only "results" such as pass/fail judgments, summarized data (averages, peaks), FFT results, or AI scores, discarding the most crucial "raw waveforms." This makes it impossible for engineers to later verify "why that anomaly judgment was made."
conanair continuously saves the "Raw Data itself," made lightweight by under-sampling, to the cloud or a local environment. This provides an environment where field engineers can check the waveforms with their own eyes and achieve correct predictive maintenance based on facts.
A: As a strict rule, check "velocity" for monitoring general rotating machinery unbalance or looseness, and "acceleration" if you want to catch early-stage bearing anomalies (flaws or chipping) as quickly as possible. conanair measures these simultaneously and saves them as raw data.
A: Yes, they change significantly. It is crucial to know "in which direction the vibration is transmitting from the source." As explained in detail in the "Correct Installation Direction" article within this category, the basic approach is to install the sensor while being mindful of the 3 axes: vertical, horizontal, and axial.
A: Because relying solely on an "anomaly score" from AI or edge processing prevents engineers from later identifying the root cause (verifying why it was judged as an anomaly). If you have the raw data, you can perform follow-up FFT analysis and make maintenance decisions with confidence.
| Company Name | NSXe Co.Ltd - Nakayama Hydrothermal Industry Co., Ltd. |
|---|---|
| Head Office | 7686-10 Hirano-cho, Suzuka, Mie513-0835, Japan zip code 513-0835 |
| Phone | +81-90-2189-1398 |
| FAX | +81-59-379-4704 |
| Business Hours | 8:00~17:00 |
| Office Regular
Holiday |
Saturday afternoons, Sundays and public holidays |
| URL | https://conanair.com/ |
| Company Name | NSXe Co.Ltd - Nakayama Hydrothermal Industry Co., Ltd. |
|---|---|
| Head Office | 7686-10 Hirano-cho, Suzuka, Mie513-0835, Japan zip code 513-0835 |
| TEL | +81-90-2189-1398 |
| FAX | +81-59-379-4704 |
| Business Hours | 8:00~17:00 |
| Office Regular
Holiday |
Saturday afternoons, Sundays and public holidays |
| URL | https://conanair.com/ |